Treasury Yields

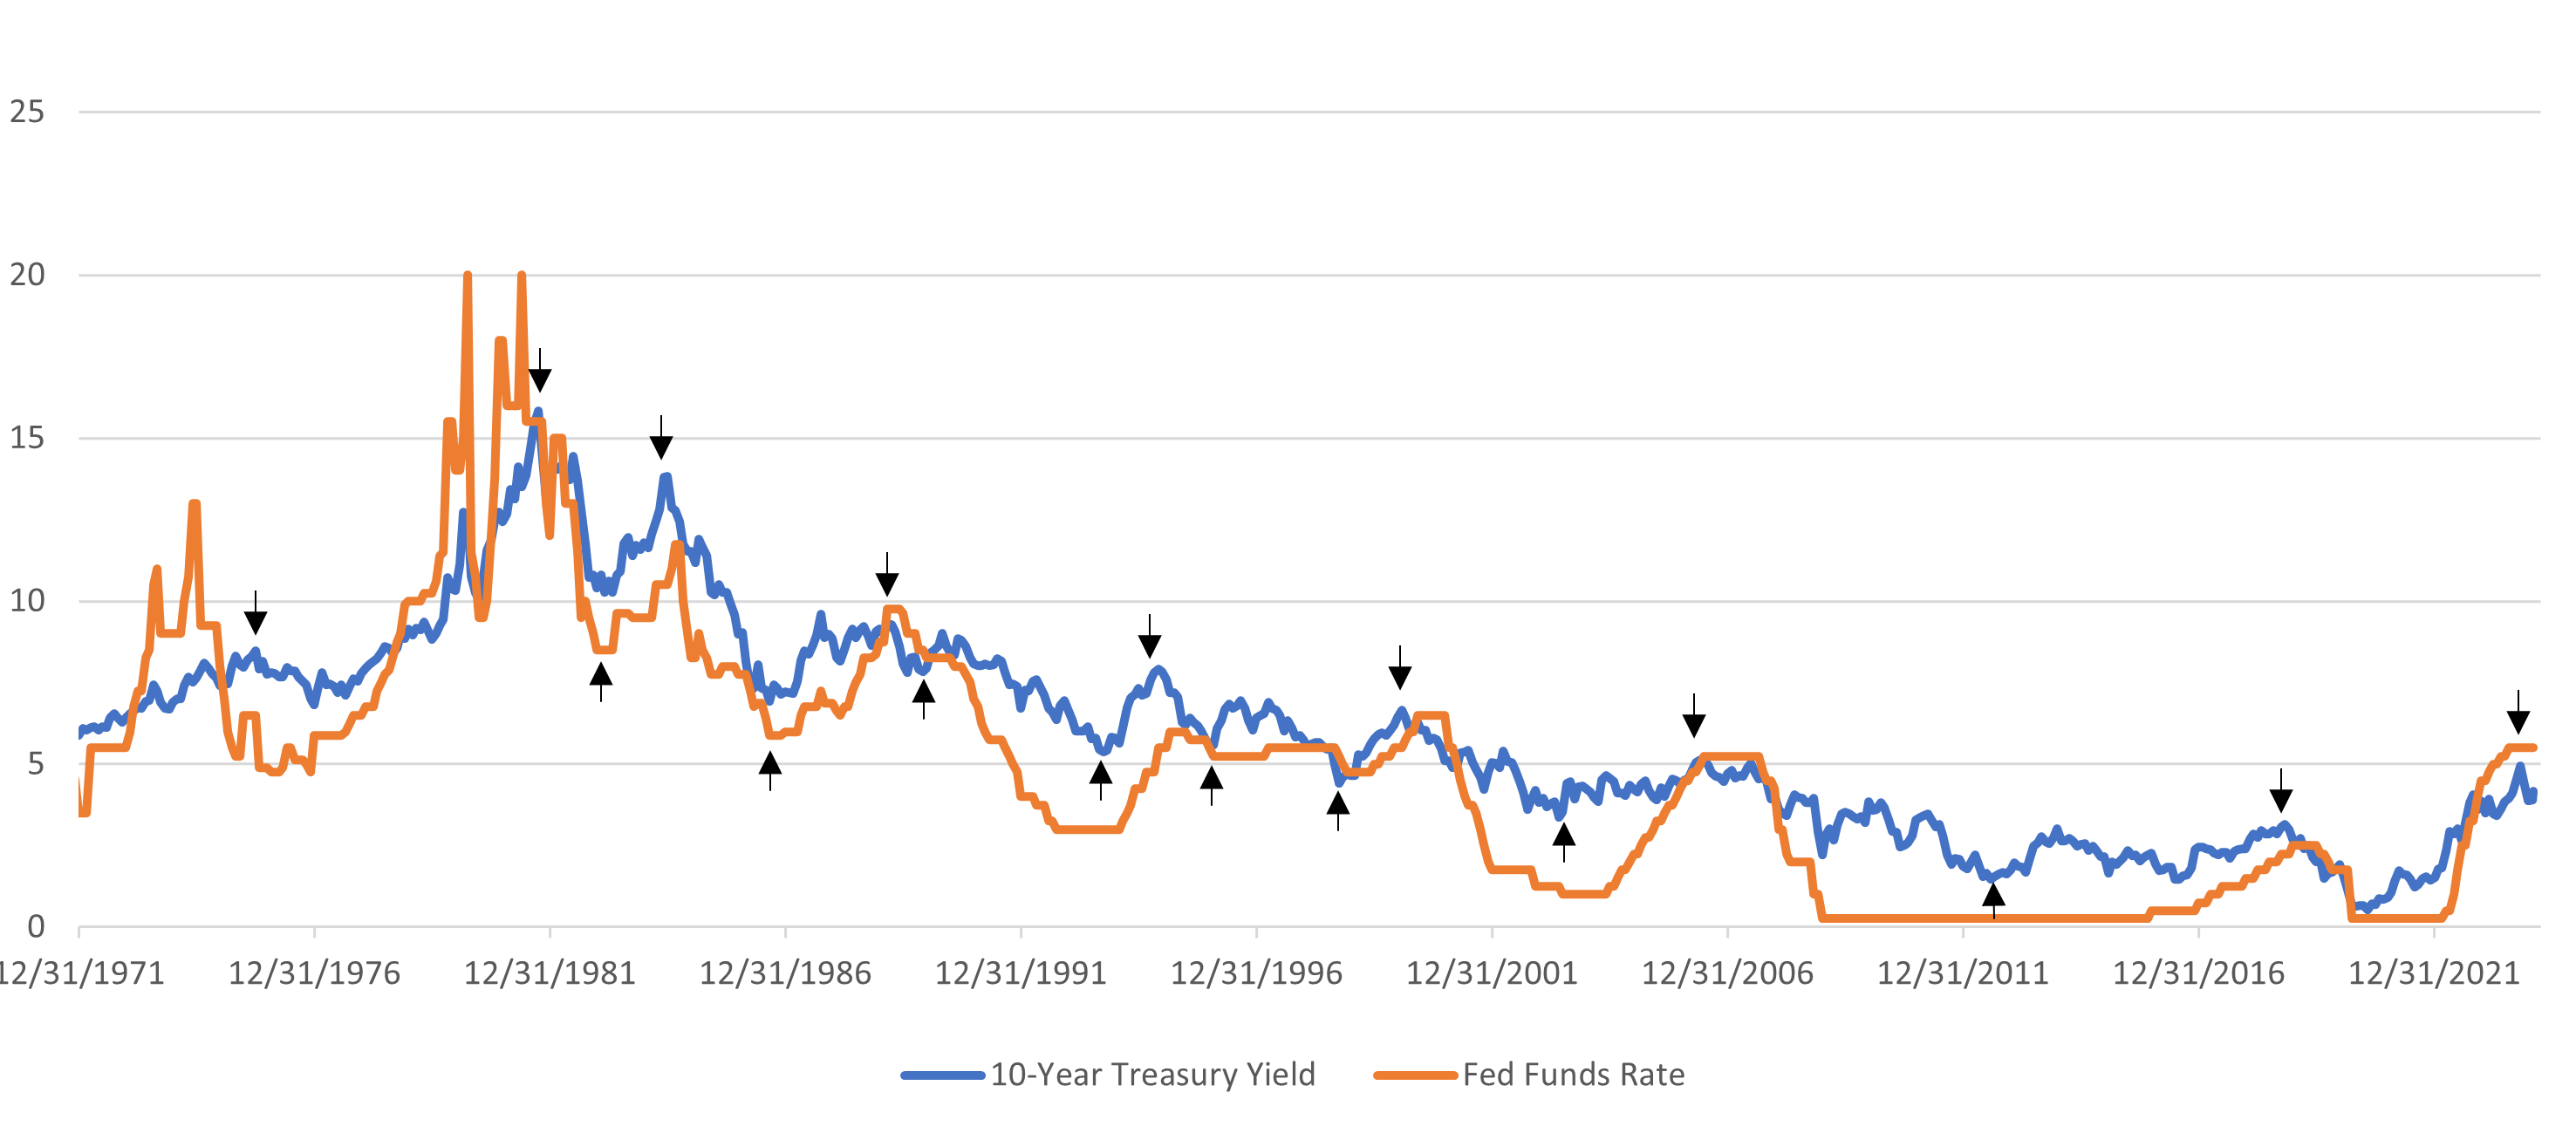
- 10-year Treasury yields have historically moved in a similar direction as the Fed Funds.
- The exception is when the bond market is anticipating the last hike or cut (sometimes incorrectly).
- The arrows show where the 10-year Treasury anticipated the eventual peak or trough in the Fed Funds rate.
- The 10-year Treasury peaked at 5% just as the Federal Open Market Committee (FOMC) hiking bias was coming to an end.
- Yields should trend lower as long as the FOMC remains biased to cut rates.
Core Bond Asset Class Performance

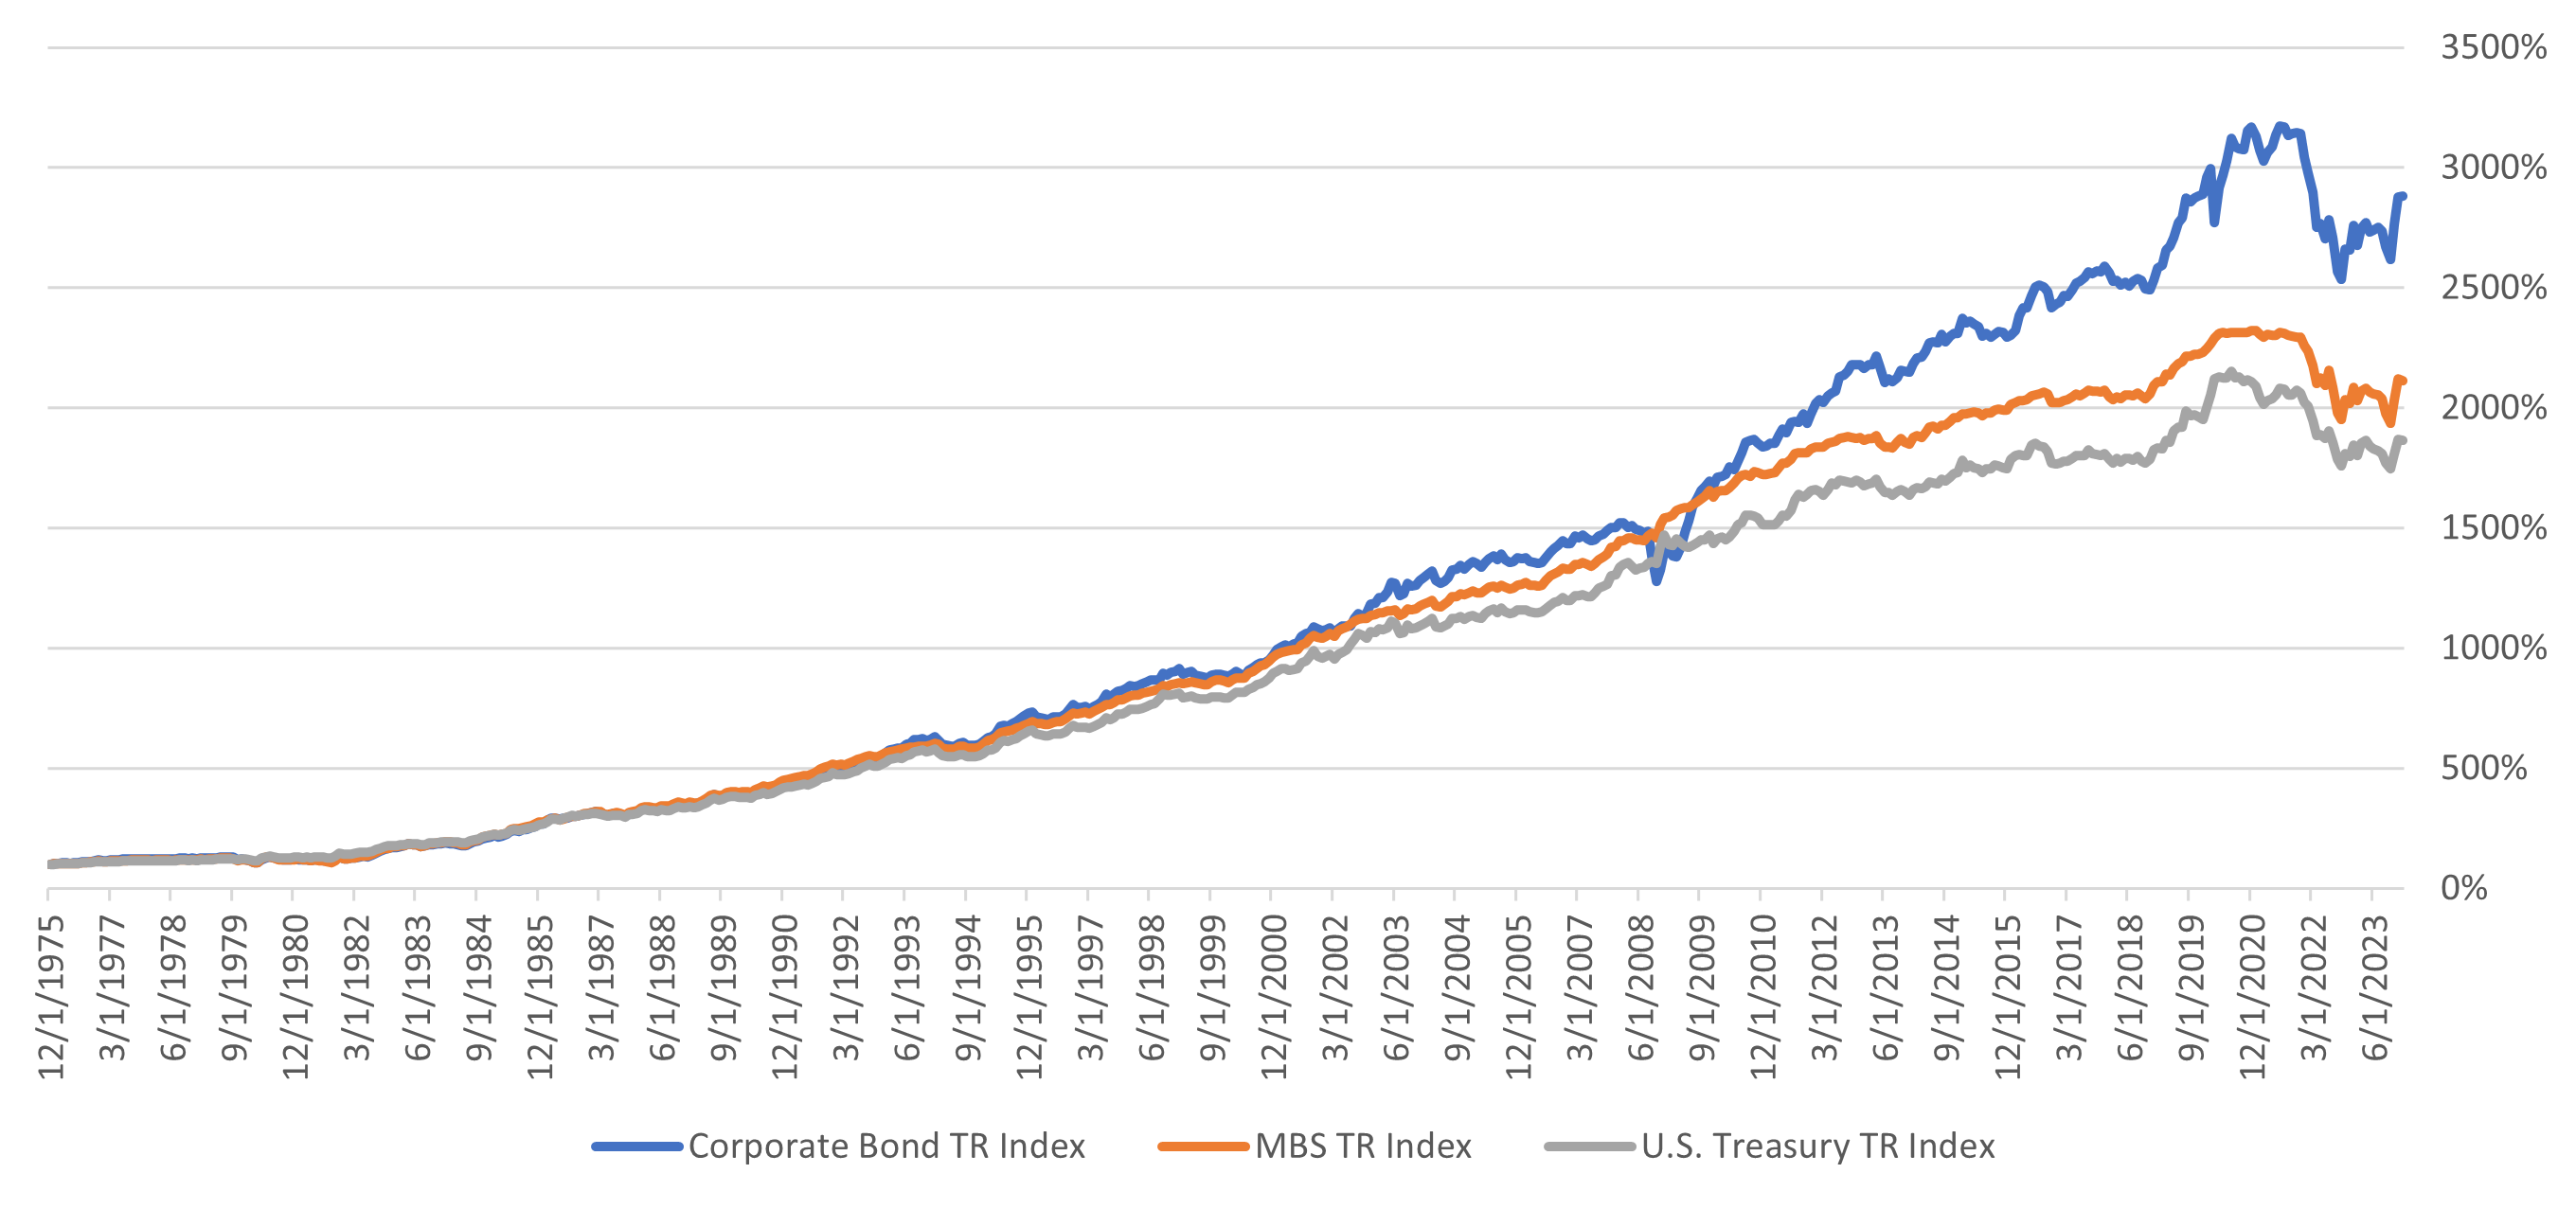
- Corporate bonds have outperformed Treasuries by nearly 100 basis points (bps) per year over the past 50 years.
- Corporate spreads are mean reverting and will cycle from high to low with little time spent at the average.
- Our proprietary strategies increase exposure as spreads widen and reduce when they are low.
- Mortgage-Backed Securities (MBS) total return indices also outperformed Treasuries in the long run.
- Currently, corporate bond spreads are at tight levels and our proprietary strategies are modestly overweight.
S&P 500 Performance – January 2024

- Equity markets rallied in January, continuing their trend from 2023.
- Growth stocks were the best performing group across all market caps.
- Small caps continue to underperform versus large caps, continuing a trend that was present during 2023.
- Investors continue to adopt a “risk-on” mentality despite relatively lofty price-to-earnings (P/E) valuations as expectations for earnings growth remain high.
United States Manufacturing Activity Improves

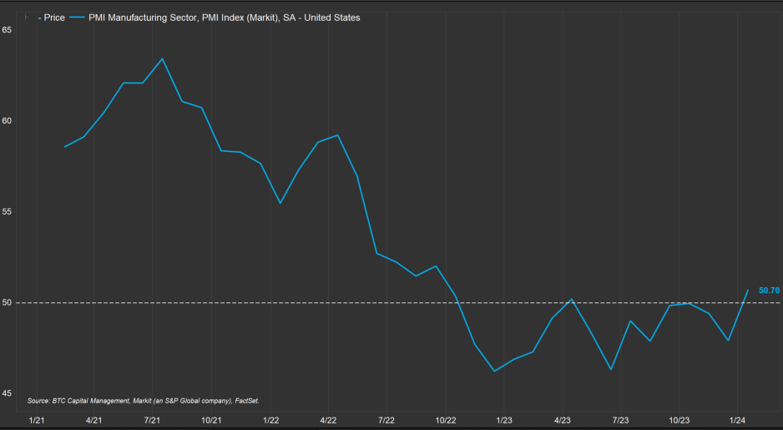
- Manufacturing activity in the United States as measured by the Manufacturing Purchasing Managers’ Index climbed to 50.3 in January (a reading over 50 indicates expansion, whereas below 50 indicates contraction in activity).
- The latest results marked the first time manufacturing activity was in expansion mode since October 2022.
- Companies are continuing the trend of “onshoring” their production and bringing manufacturing activity back to the United States.
- While manufacturing constitutes less of the overall economy than it did previously, it is still an important part of the United States Gross Domestic Product (GDP) and is aiding in the generation of steady economic growth.
Nonfarm Payrolls Surge

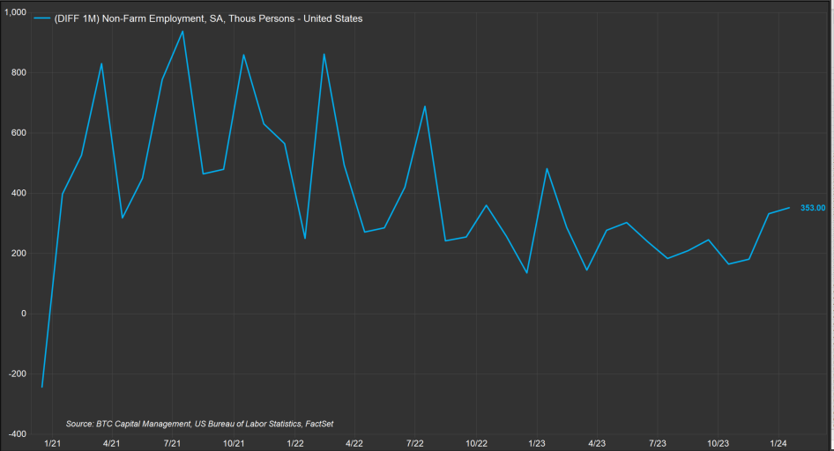
- January’s Nonfarm Payroll release showed 353,000 new positions were added during the month. This was the highest number in two years, topping expectations of 175,000 and besting December 2023’s figure of 330,000, which was revised upward.
- The unemployment rate remained unchanged at 3.7%. The participation rate was also unchanged at 62.5%.
- The healthcare and retail sectors saw the largest number of new positions created.
- Wage growth and hourly earnings also kept pace, signaling the Federal Reserve may not move quickly to lower rates.
Investment and Insurance Products are:
- NOT INSURED BY THE FDIC
- NOT INSURED BY ANY FEDERAL GOVERNMENT AGENCY
- NOT A DEPOSIT OF OTHER OBLIGATION OF, OR GUARANTEED BY, HERRING BANK, OR ANY BANK AFFILIATE
- SUBJECT TO INVESTMENT RISKS, INCLUDING POSSIBLE LOSS OF THE PRINCIPAL AMOUNT INVESTED

